

Follow live events
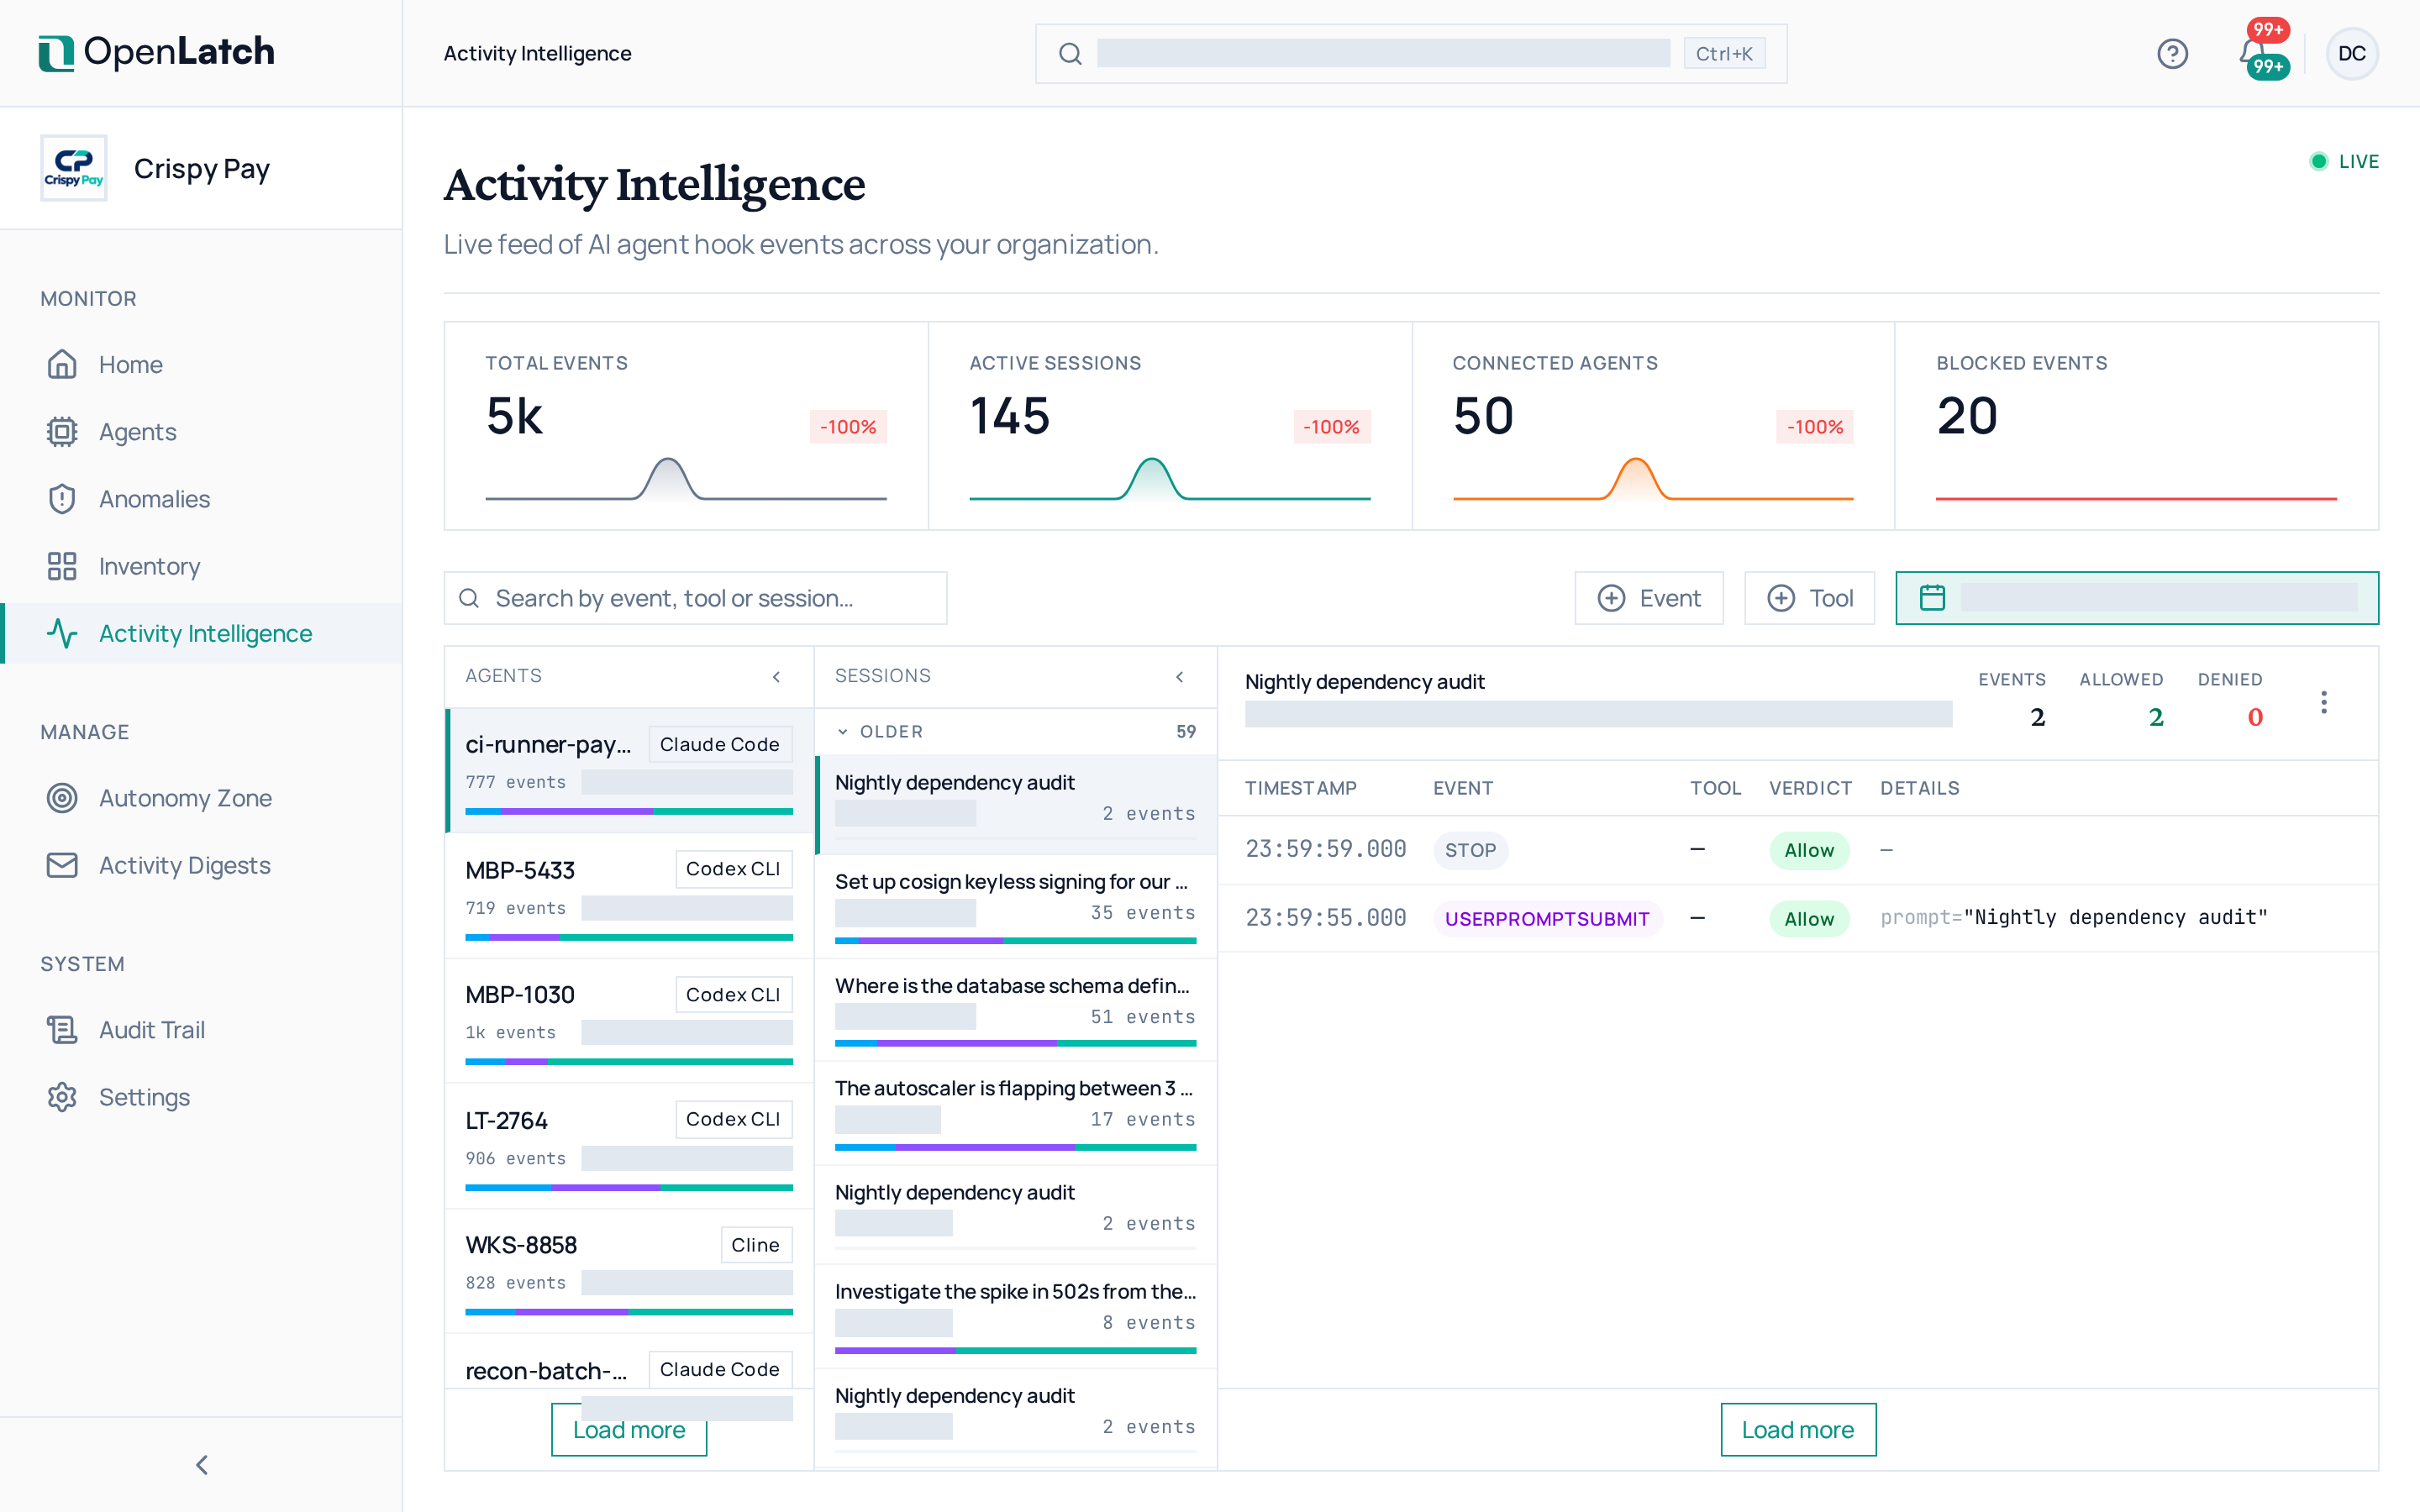
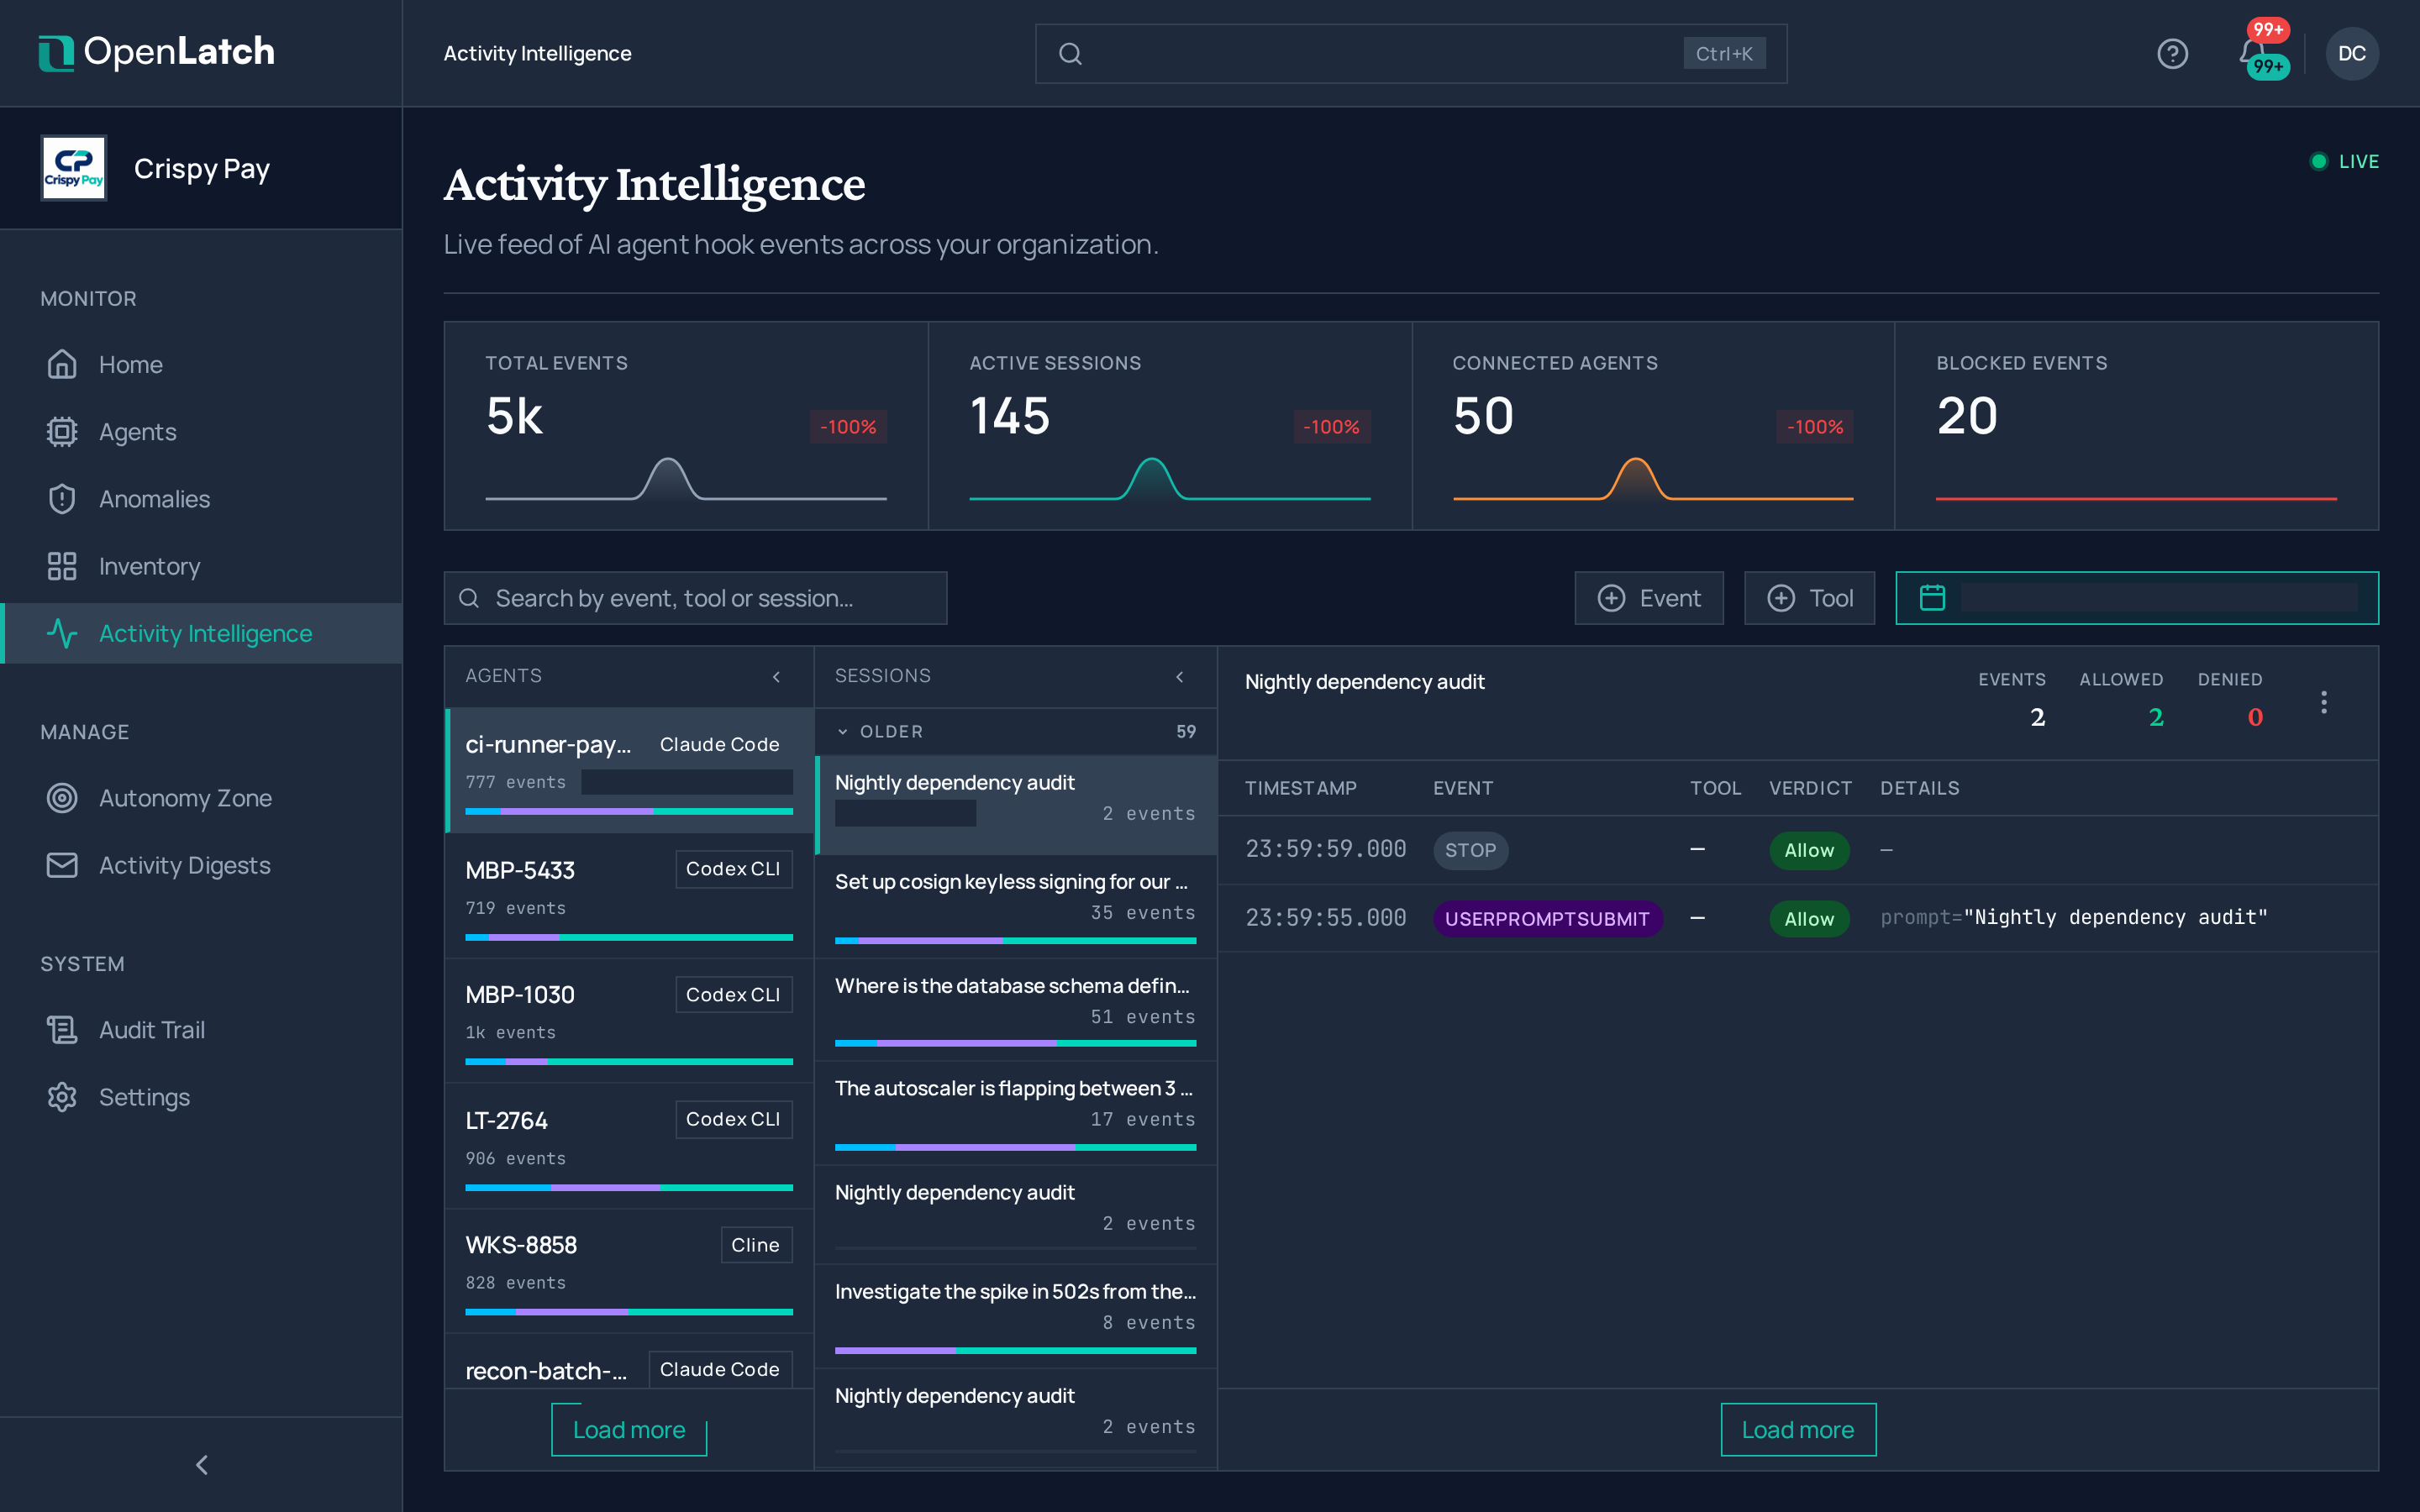
Use Activity Intelligence, the console’s live events page at /events, to watch what agents are doing right now: every hook event across your organization, as it arrives. Every role can read it.
Read the feed
Section titled “Read the feed”The figures at the top count, over the selected time range, the events received, the active sessions, the connected agents and the blocked events, each compared with the previous half of the window. A live indicator shows that the feed is connected.
Below them, sessions are listed on the left, grouped into Active now, Recent and Older. Select a session to read its events on the right, in order. Open an event for its detail.
| To | Do this |
|---|---|
| Find an event | Search by event, tool or session |
| Narrow the feed | Filter by event type, tool or time range |
| Start over | Choose Clear filters |
Before the first event
Section titled “Before the first event”Right after you connect a client, the page shows Awaiting first agent activity: the client is connected and nothing has happened yet. The first event appears as soon as an agent invokes a tool. If nothing appears after the agent has worked for a while, run openlatch doctor on the machine; see Verify and roll out.
For the full history of one agent rather than the live feed, use its tabs; see Investigate what an agent did.