

Execution graph
The execution graph is the record of what an agent actually did. It is built from the events the client sends after each decision, and it is what OpenLatch checks against the agent’s Autonomy Zone.
What it shows
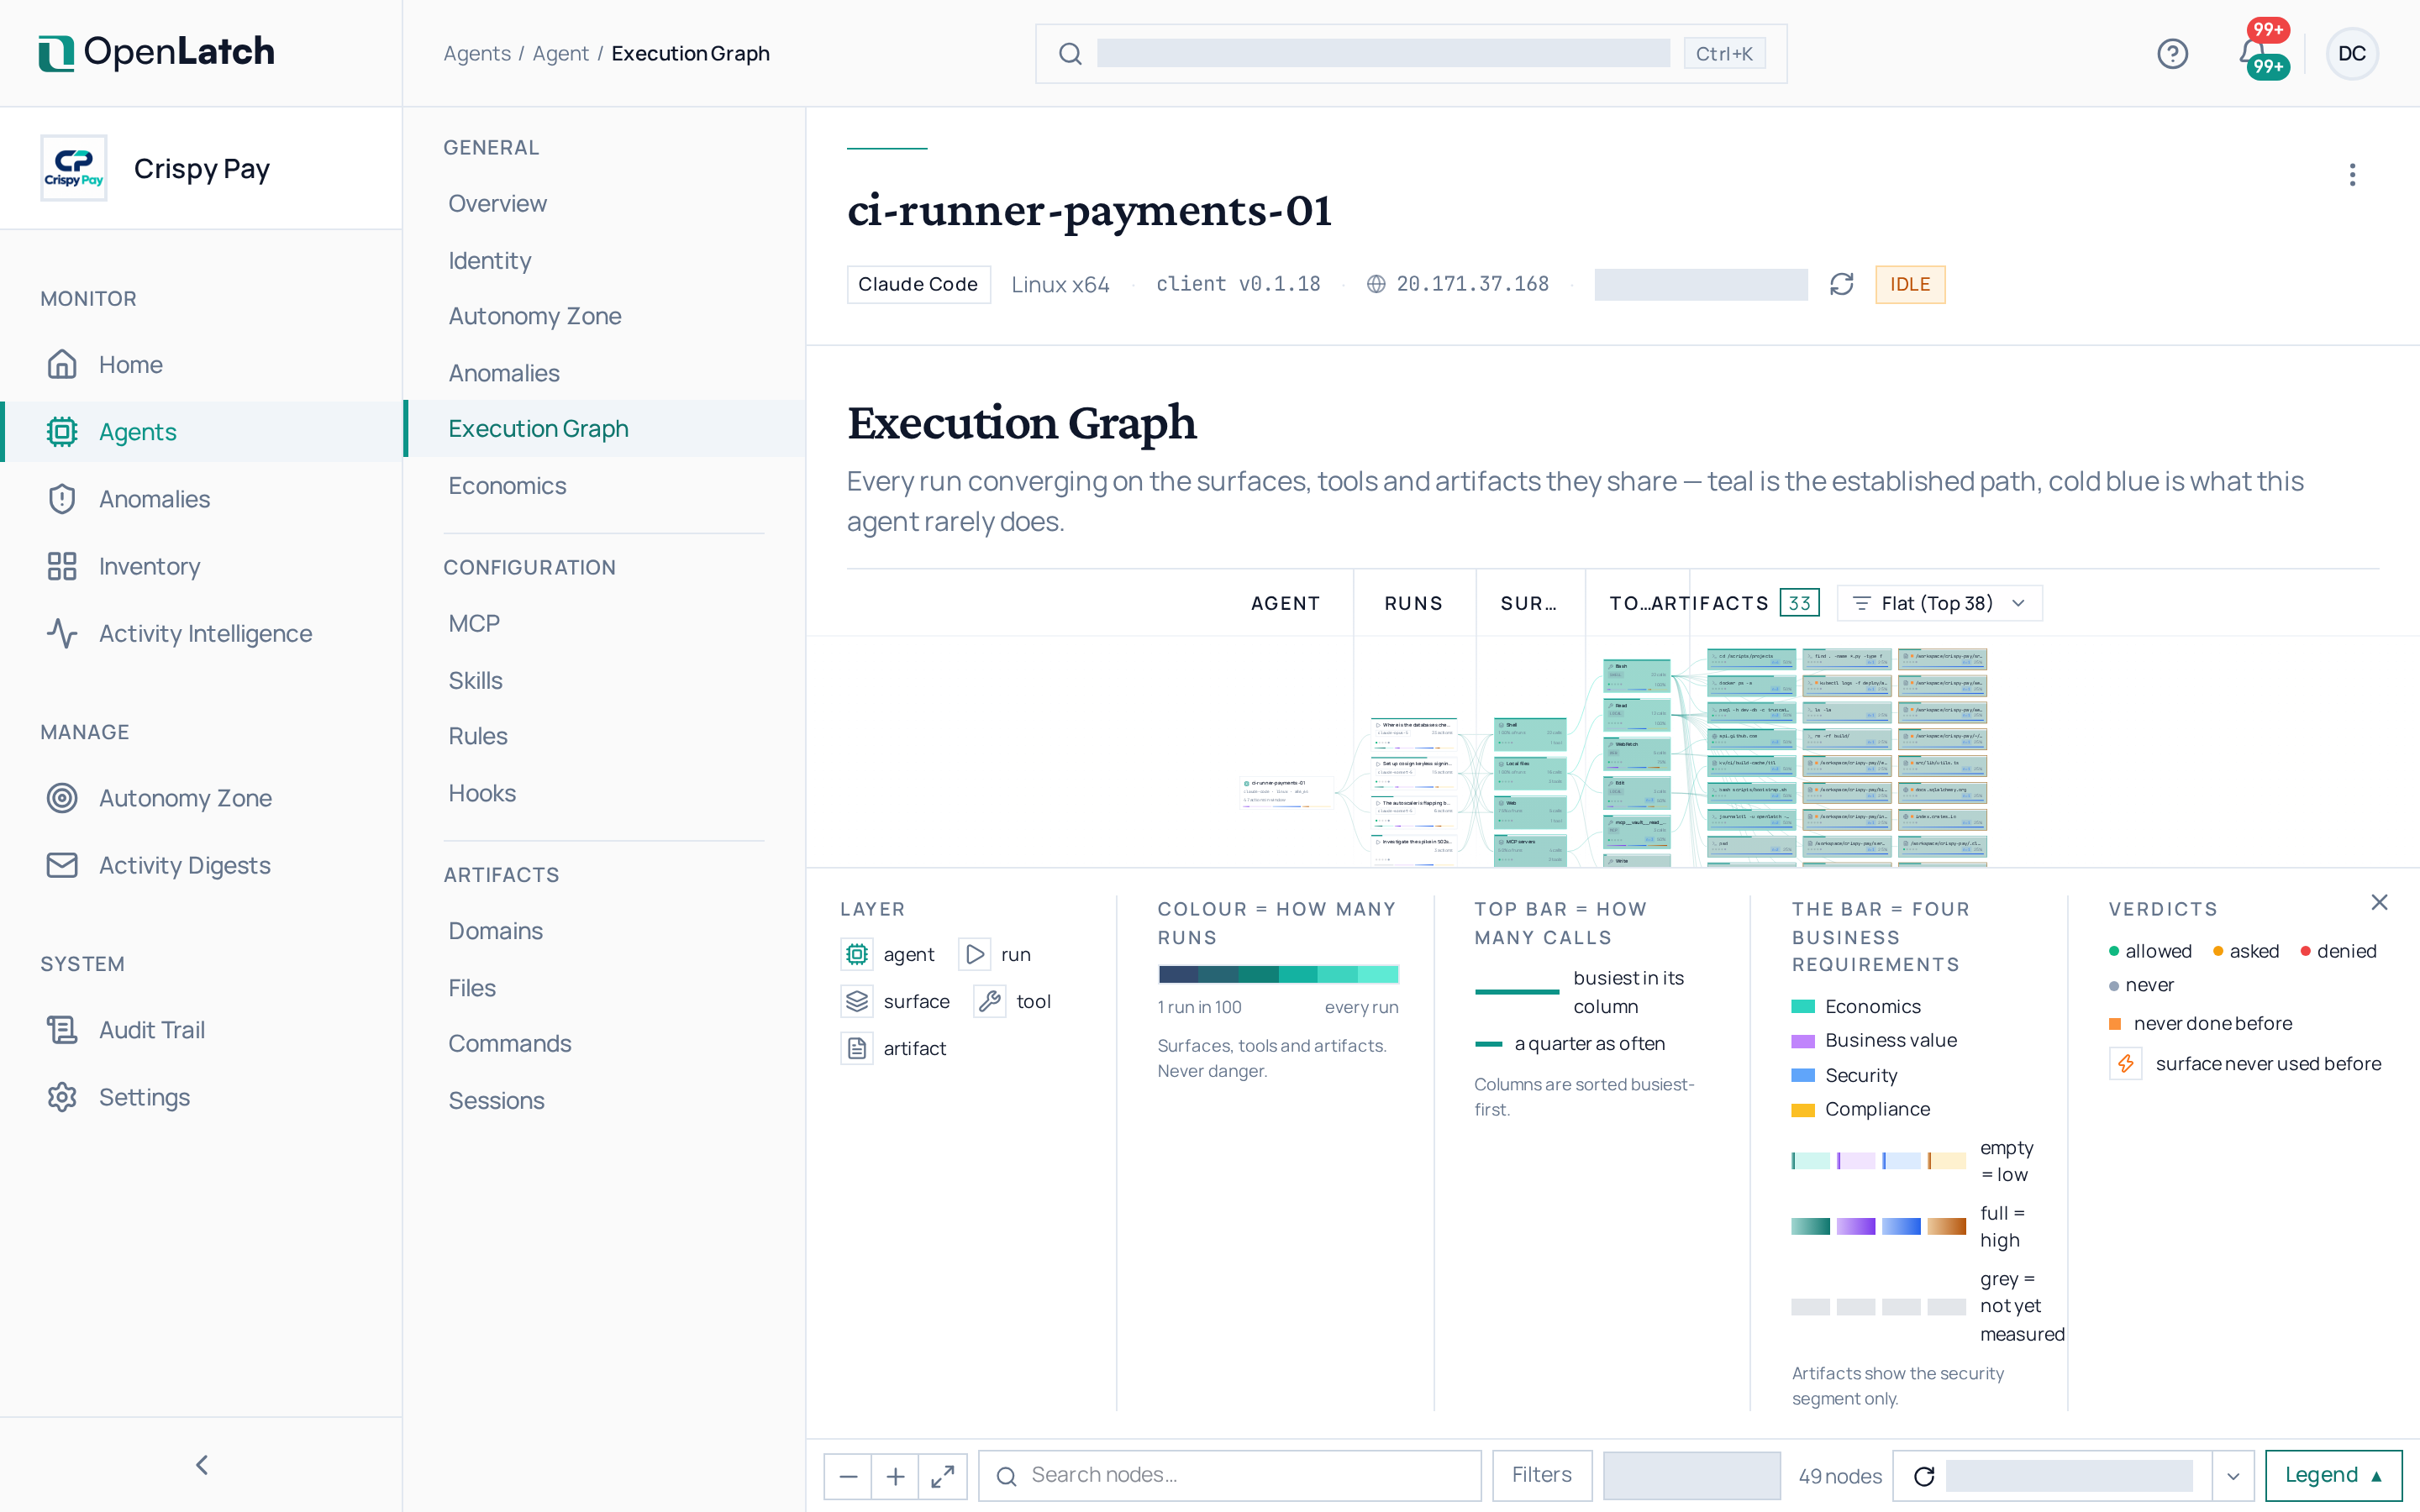
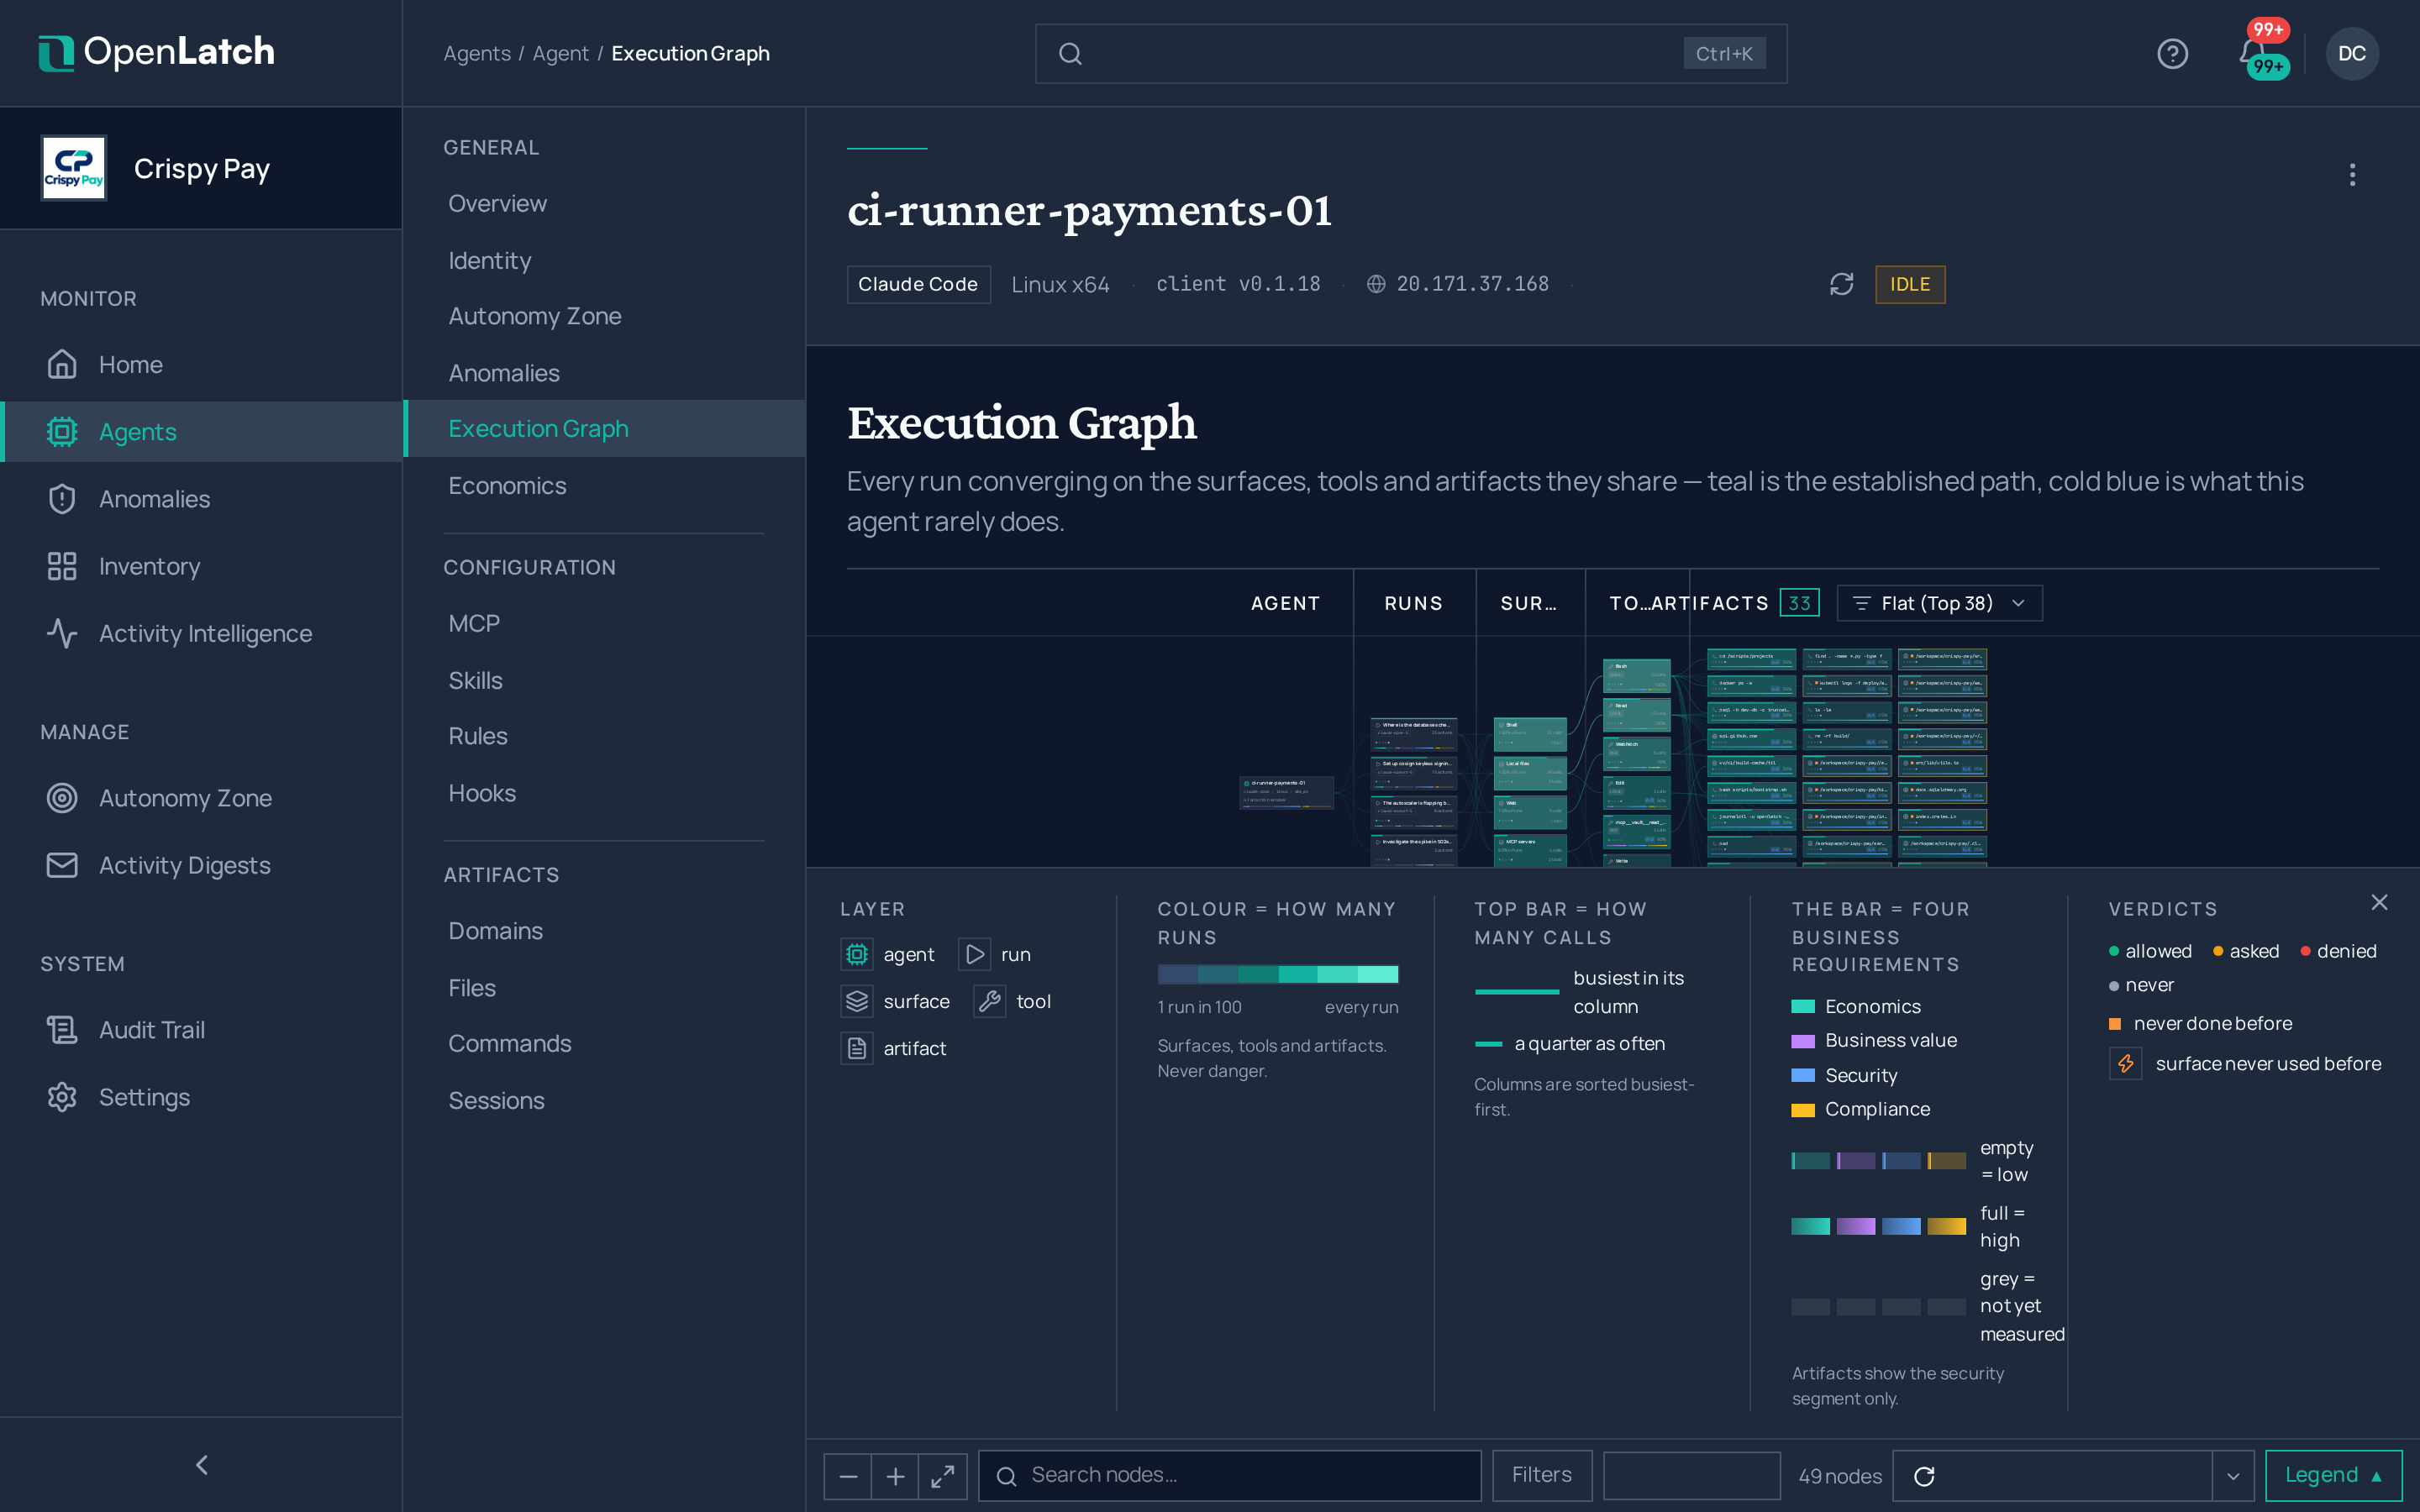
Section titled “What it shows”Each agent has an Execution Graph tab. It reads from left to right, from the agent to what it touched:
| Lane | What it holds |
|---|---|
| Agent | The agent the graph is about |
| Runs | Its sessions, one card per run |
| Surfaces | What it reached for, derived from the tool names |
| Tools | What it invoked |
| Artifacts | What it touched or ran: files, network domains and commands |
The lanes converge on what the runs share, so you see the paths an agent takes most and the ones it takes rarely.
Two planes feed it
Section titled “Two planes feed it”| Plane | What the client captures |
|---|---|
| Command plane | Each tool call and shell command, caught at the agent’s native hook before it runs |
| Request plane | Each outbound model request, caught at a listener on the same machine, with its model, its tokens and its cost |
The other tabs of an agent break the same record down by kind: commands, files, domains, MCP servers, skills, hooks, sessions and economics.
From an action to a policy
Section titled “From an action to a policy”When the graph shows a command you want to govern, open it and start a new intent policy from that action. The brief starts from what the agent actually ran, and the policy goes through the same review and ratification as any other. Intent policies explains that path.
An action that no policy decided is recorded as allowed by default, not as permitted by a decision. The graph tells the two apart.